Enriching content recommendations on VRT MAX streaming
A prototyping study exploring how cross-platform data can sharpen recommendations for Flanders' public broadcaster, evaluated through expert reviews and focus groups.


The challenge
To compete with major international streaming services, Flemish public broadcaster VRT explored leveraging cross-platform data — such as Spotify listening history and news reading preferences — to deliver richer, highly personalised content recommendations on VRT MAX (streaming platform). To guarantee user privacy, personal data vault technology was considered to give audiences full control over their data.
To evaluate this new concept, we built an interactive prototype to assess audience readiness, trust, and willingness to share third-party media data.
- My role
- Lead UX designer
- Partners
- VRT MAX
- Status
- Completed
The process
01 — Concept ideation
Stakeholder alignment & defining data scope
To explore how cross-platform data could enhance content recommendations, we conducted a collaborative workshop with key stakeholders.
Given the early stage and exploratory nature of the project, we intentionally kept the scope broad by including a diverse range of data types — from standard demographics to media preferences like Spotify history and online shopping behaviour. Granting access to Spotify listening history, for instance, could surface music documentaries featuring frequently played artists.
Deliberately testing these more sensitive data types allowed us to identify clear user boundaries regarding data sharing.
 Recommendations
Demographics
Age
Name
Home address
Current location
Recommendations
Demographics
Age
Name
Home address
Current location
 Streaming history
My list
Streaming history
My list
 Listening history
Followed artists
Listening history
Followed artists
 Read news articles
Favourite themes
Culture record
Library borrowing
Cultural activities
Read news articles
Favourite themes
Culture record
Library borrowing
Cultural activities
 Purchase history
Shopping wishlist
Purchase history
Shopping wishlist
 Search query logs
Browsing history
Search query logs
Browsing history
 Likes
Friends list
Followed pages
Likes
Friends list
Followed pages
02 — Initial prototyping
Wireframing to mid-fidelity prototype
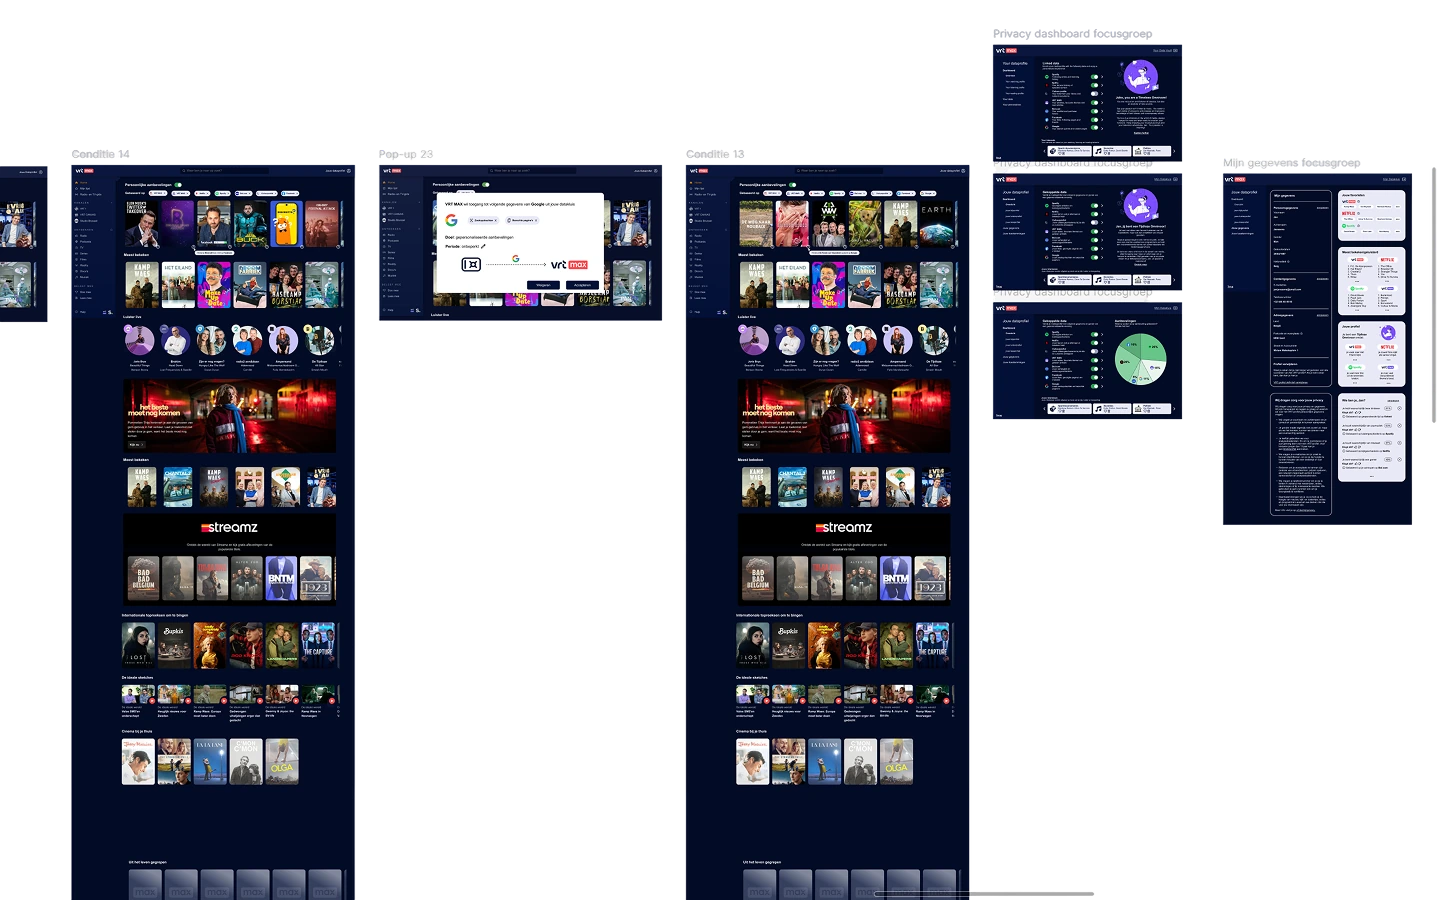
After defining the core concept, we mapped user flows through iterative wireframing and built a mid-fidelity Figma prototype to prepare for expert evaluation.
03 — Expert review
Multi-disciplinary feedback walkthrough
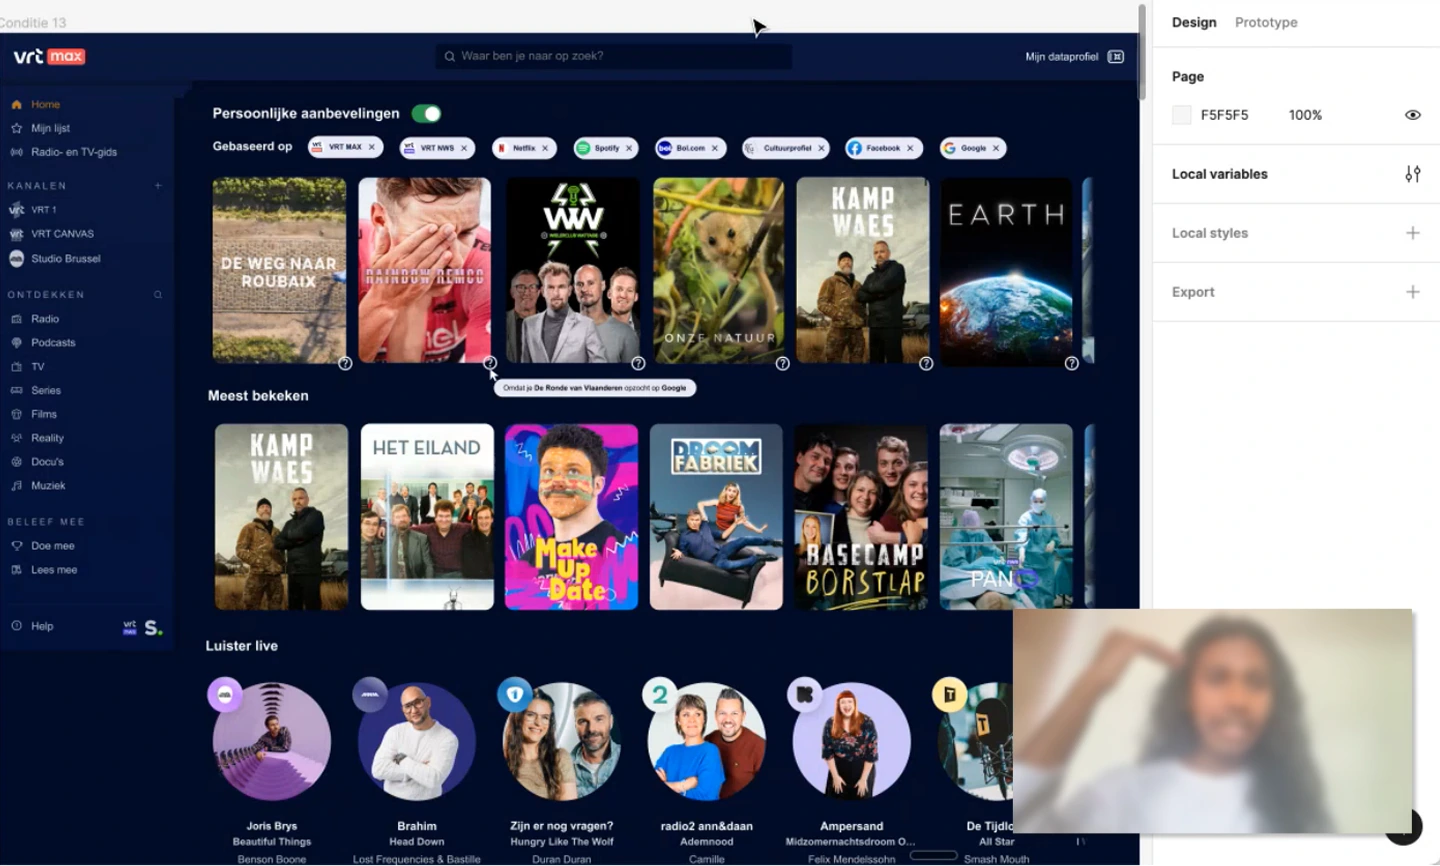
To refine the prototype prior to user testing, we conducted an expert walkthrough with 5 specialists spanning UX, innovation research, privacy, and human-data interaction.
What the experts asked us to change
04 — High-fidelity prototyping
Interactive prototype with privacy controls
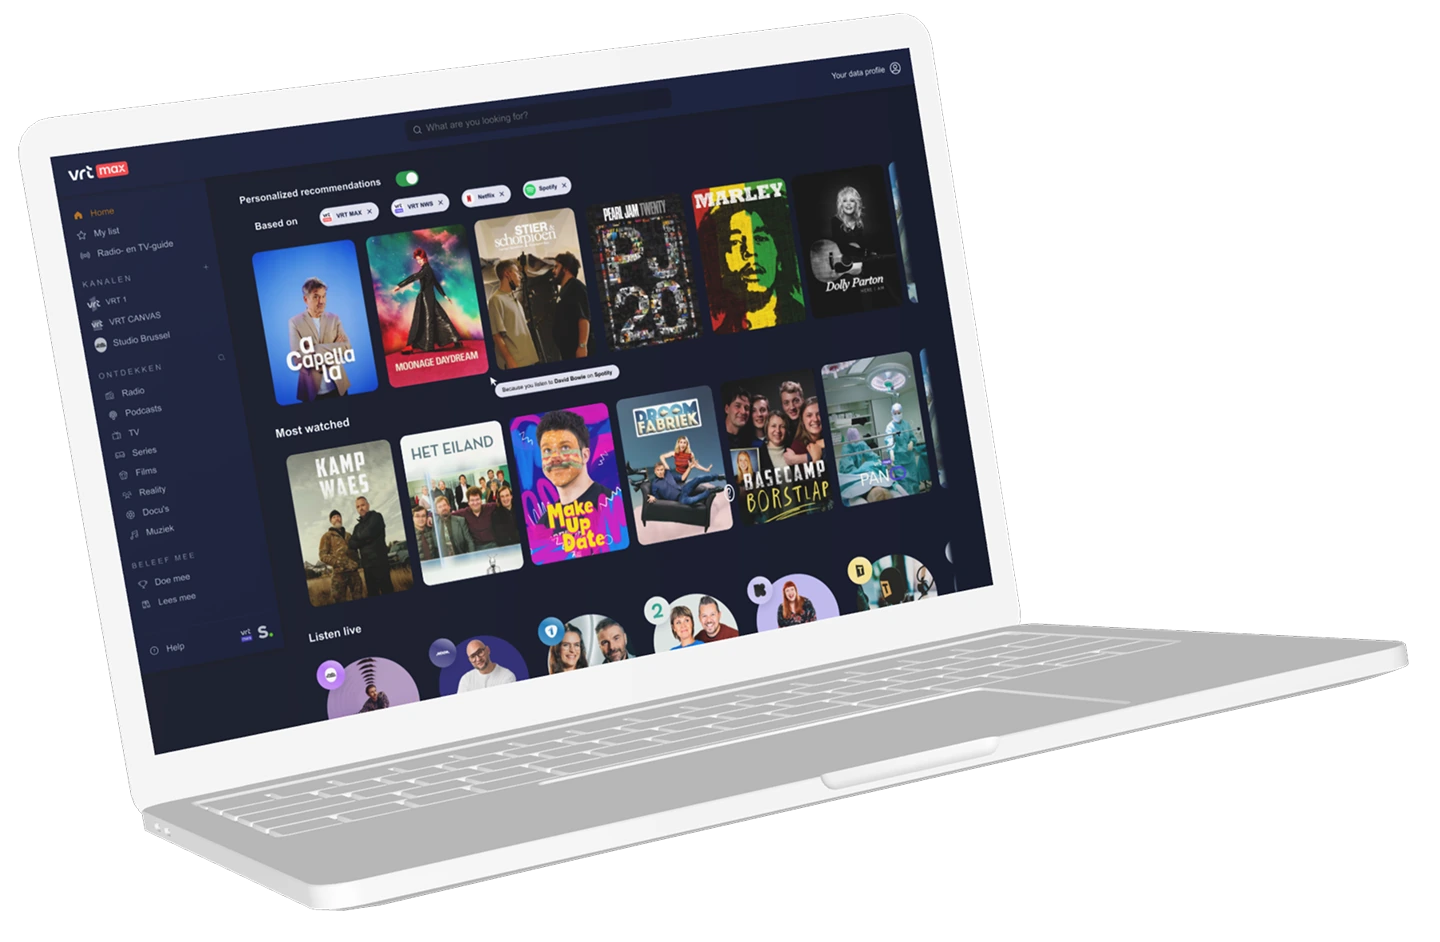
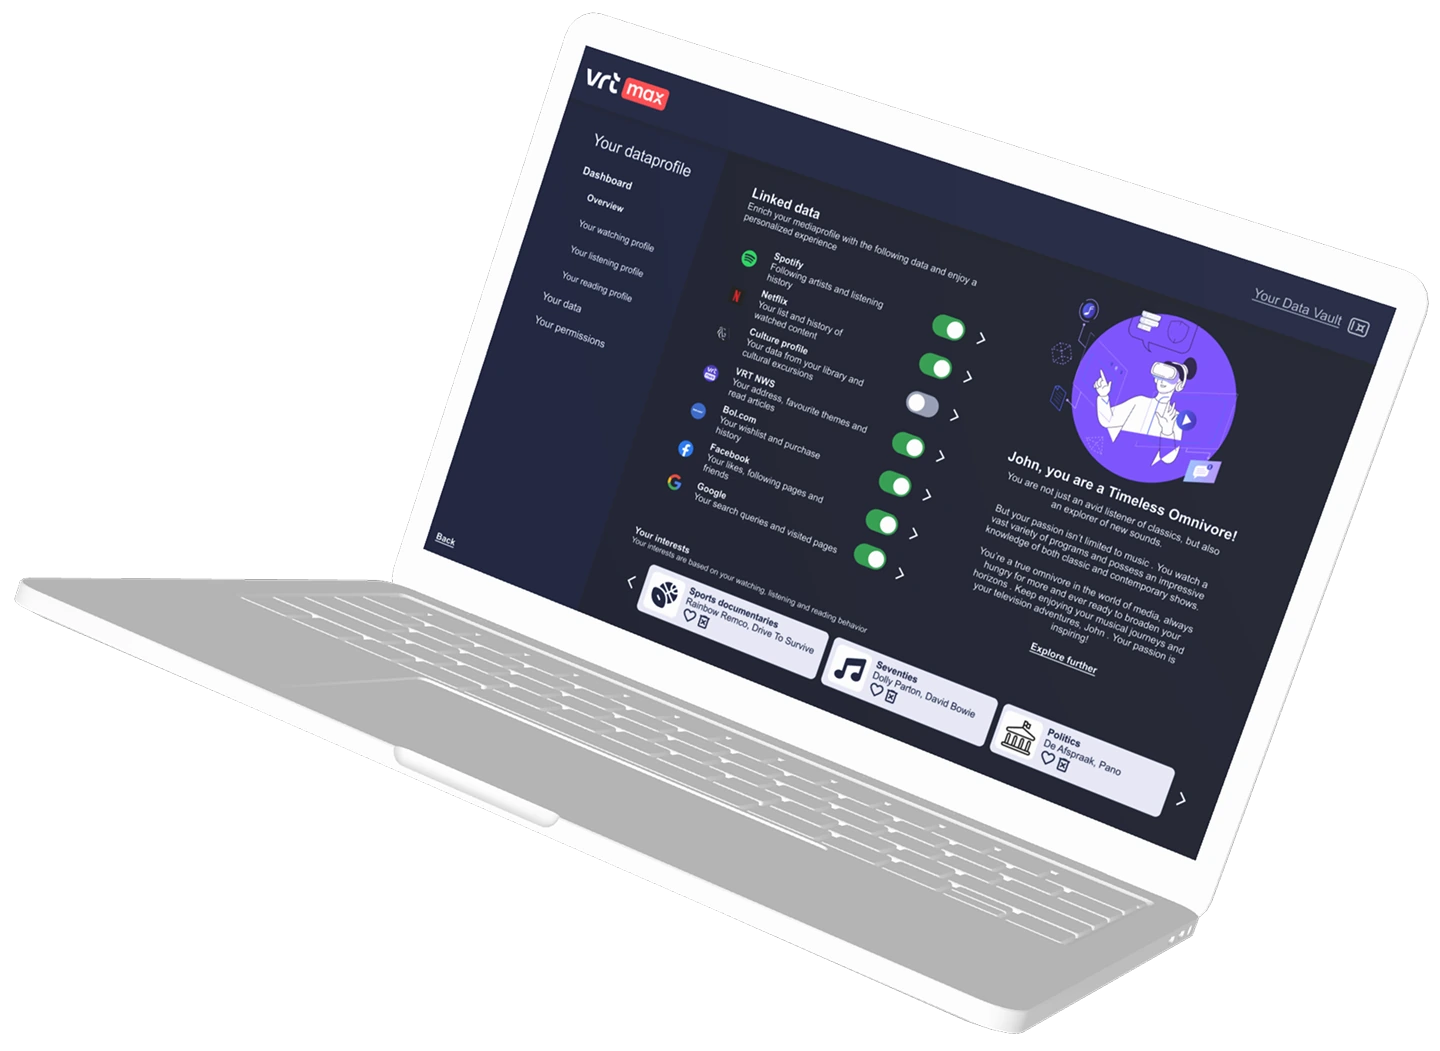
Based on expert feedback, we progressed from a static mid-fidelity prototype to a high-fidelity, interactive Figma prototype. This prototype reflected a realistic usage scenario, prompting users with requests for various data types.
Key features integrated into the existing VRT MAX streaming platform included an enhanced recommendation section and a personalised user profile to control data sharing.
VRT MAX
05 — Focus groups
Evaluating concept readiness & willingness to share data
Because VRT prioritised validating the overall concept over usability testing at this early exploratory stage, we conducted focus groups with 19 target users.
Participants explored the prototype and shared their perspectives on the data vault integration and data permission requests. Each session concluded with an individual evaluation where participants rated various data types across two dimensions: comfort level with sharing and perceived value generated.

06 — Data analysis & results
Qualitative insights
“I am so often in a filter bubble already and I am getting profiled so much that I want to break out of it. I want to get suggestions that I wouldn’t look for myself.”
Focus group participant
Quantitative insights: willingness to share data
As illustrated below, participants were most comfortable sharing media-related data (such as Netflix history and news articles), viewing it as directly beneficial for personalised recommendations. Conversely, online behavioural data — including browsing and purchase history — was perceived as highly sensitive yet offering low added value.
07 — Impact